Jaemin Song, Hyunbum Kim, Yong Oh Lee
Heliyon, Dec 2024
Motivation
Accurate early diagnosis of laryngeal cancer and related diseases using voice data is still challenging.
Most existing studies rely on mel-frequency cepstral coefficients (MFCC), which are excellent at capturing speech patterns that align with human auditory perception.
However, MFCC compresses low-frequency regions (including the fundamental frequency and sub-formant ranges) into very few filters.
This is problematic because:
- The fundamental frequency (≈90–130 Hz in male voices) and regions below the first formant (<700 Hz) often contain pathological cues.
- Early changes in laryngeal cancer or vocal fold paralysis manifest as subtle irregularities in these low-frequency ranges.
- By under-representing these regions, MFCC risks losing critical diagnostic information.
Why 1/3 Octave Band Filters?
The 1/3 octave band filter was adopted because:
- It provides logarithmic spacing of frequency bands, offering finer resolution at lower frequencies and coarser resolution at higher ones.
- This matches how voice disorders actually alter signals:
- Low-frequency instability (fundamental and sub-formant changes in cancer/paralysis).
- Over-formant noise (irregular high-frequency harmonics caused by pathological vocal fold vibration).
- Compared to MFCC:
- <200 Hz region: MFCC → 2 filters, OFSE(1/3 octave) → ~12 filters.
- <700 Hz (below F1): MFCC → 6 filters, OFSE → ~17 filters.
Thus, OFSE preserves the acoustic nuances most affected by laryngeal disease, while still representing formant and higher frequencies.
| Filter Index | Lower edge | Center Frequency | Upper edge | Filter Index | Lower edge | Center Frequency | Upper edge |
|---|---|---|---|---|---|---|---|
| 1 | 0 | 96.33 | 205.92 | 14 | 3041.47 | 3556.35 | 4142.09 |
| 2 | 96.33 | 205.92 | 330.59 | 15 | 3556.35 | 4142.09 | 4808.44 |
| 3 | 205.92 | 330.59 | 472.41 | 16 | 4142.09 | 4808.44 | 5566.49 |
| 4 | 330.59 | 472.41 | 633.76 | 17 | 4808.44 | 5566.49 | 6428.86 |
| 5 | 472.41 | 633.76 | 817.3 | 18 | 5566.49 | 6428.86 | 7409.91 |
| 6 | 633.76 | 817.3 | 1026.11 | 19 | 6428.86 | 7409.91 | 8525.96 |
| 7 | 817.3 | 1026.11 | 1263.65 | 20 | 7409.91 | 8525.96 | 9795.6 |
| 8 | 1026.11 | 1263.65 | 1533.88 | 21 | 8525.96 | 9795.6 | 11239.96 |
| 9 | 1263.65 | 1533.88 | 1841.29 | 22 | 9795.6 | 11239.96 | 12883.09 |
| 10 | 1533.88 | 1841.29 | 2191.02 | 23 | 11239.96 | 12883.09 | 14752.34 |
| 11 | 1841.29 | 2191.02 | 2588.87 | 24 | 12883.09 | 14752.34 | 16878.83 |
| 12 | 2191.02 | 2588.87 | 3041.47 | 25 | 14752.34 | 16878.83 | 19297.96 |
| 13 | 2588.87 | 3041.47 | 3556.35 | 26 | 16878.83 | 19297.96 | 22050 |
| Filter Index | Lower edge | Center Frequency | Upper edge | Filter Index | Lower edge | Center Frequency | Upper edge |
|---|---|---|---|---|---|---|---|
| 0 | 11.22 | 12.59 | 14.13 | 18 | 707.95 | 794.33 | 891.25 |
| 1 | 14.13 | 15.85 | 17.78 | 19 | 891.25 | 1000.00 | 1122.02 |
| 2 | 17.78 | 19.95 | 22.39 | 20 | 1122.02 | 1258.93 | 1412.54 |
| 3 | 22.39 | 25.12 | 28.18 | 21 | 1412.54 | 1584.89 | 1778.28 |
| 4 | 28.18 | 31.62 | 35.48 | 22 | 1778.28 | 1995.26 | 2238.72 |
| 5 | 35.48 | 39.81 | 44.67 | 23 | 2238.72 | 2511.89 | 2818.38 |
| 6 | 44.67 | 50.12 | 56.23 | 24 | 2818.38 | 3162.28 | 3548.13 |
| 7 | 56.23 | 63.10 | 70.79 | 25 | 3548.13 | 3981.07 | 4466.84 |
| 8 | 70.79 | 49.43 | 89.13 | 26 | 4466.84 | 5011.87 | 5623.41 |
| 9 | 89.13 | 100.00 | 112.20 | 27 | 5623.41 | 6309.57 | 7079.46 |
| 10 | 112.20 | 125.89 | 141.25 | 28 | 7079.46 | 7943.28 | 8912.51 |
| 11 | 141.25 | 158.49 | 177.83 | 29 | 8912.51 | 10000.00 | 11220.18 |
| 12 | 177.83 | 199.53 | 223.87 | 30 | 11220.18 | 12589.25 | 14125.38 |
| 13 | 223.87 | 251.19 | 281.84 | 31 | 14125.38 | 15848.93 | 17782.79 |
| 14 | 281.84 | 316.23 | 354.81 | 32 | 17782.79 | 19952.62 | 22387.21 |
| 15 | 354.81 | 398.11 | 446.68 | 33 | 22387.21 | 25118.86 | 28183.83 |
| 16 | 446.68 | 501.19 | 562.34 | 34 | 28183.83 | 31622.78 | 35481.34 |
| 17 | 562.34 | 630.96 | 707.95 | 35 | 35481.34 | 39810.72 | 44668.36 |
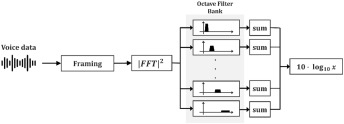
It processes audio by segmenting it into frames and converting them to the frequency domain, but instead of the mel scale, it applies a logarithmic octave filter bank.
This enhances resolution in low frequencies, making OFSE especially effective for detecting subtle anomalies in laryngeal pathologies.
Methods (Summary)
- Dataset: 363 male voices (155 healthy, 30 cancer, 81 benign mucosal disease, 97 paralysis).
- Feature Extraction:
- MFCC: 26 mel filters, 13 coefficients.
- OFSE (1/3 octave): Full-band 11–44.6 kHz, segmented into 36 logarithmic filters.
- Model: ResNet CNN, trained with 5-fold CV.
- Explainability: Grad-CAM used to visualize discriminative frequency regions.
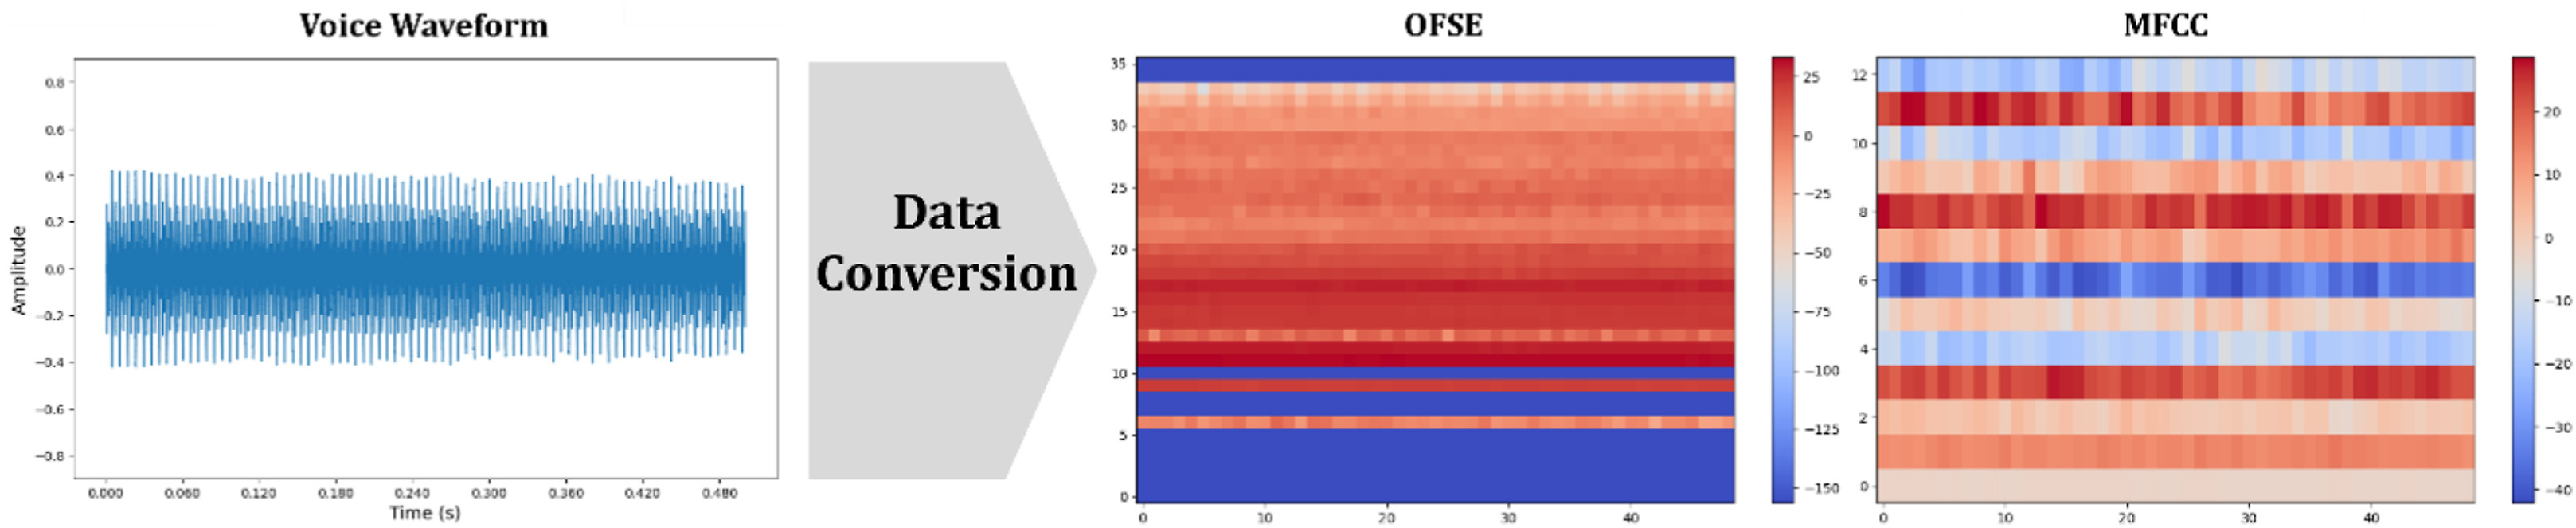
We delve into the technical nuances of Mel Frequency Cepstral Coefficients (MFCC) and octave frequency spectrum energy (OFSE), comparing their suitability and effectiveness in processing voice data for the detection of laryngeal cancer
Results
- Binary tasks:
- Healthy vs. Cancer → OFSE = 1.00, MFCC = 0.99
- Healthy vs. Paralysis → OFSE = 0.99, MFCC = 0.90
- Healthy vs. Benign → OFSE = 0.99, MFCC = 0.90
- Four-class classification:
- OFSE = 0.94 ± 0.02, MFCC = 0.71 ± 0.06
Grad-CAM confirmed that under-formant (<700 Hz)** and **over-formant (>1.7 kHz) regions were decisive for accurate classification — precisely the ranges where octave band filters provide finer resolution.
Discussion
The decision to use 1/3 octave band filters was driven by the clinical insight that laryngeal pathology manifests most strongly in low-frequency voice characteristics.
MFCC, though widely used, sacrifices resolution in these regions.
By contrast, OFSE distributes more filters to the fundamental and sub-formant ranges, making subtle changes visible to CNN models.
This explains why OFSE outperforms MFCC not only in binary tasks (healthy vs. cancer) but especially in the harder cases: benign vs. healthy, or paralysis vs. healthy.
Conclusion
1/3 octave band filters were chosen because they align both with human auditory perception and with the acoustic signatures of laryngeal disease.
By preserving critical low-frequency details, OFSE achieves higher diagnostic accuracy and improves interpretability through Grad-CAM.
This establishes OFSE as a promising feature extraction method for AI-driven, non-invasive voice-based diagnosis.